Table
In order to make users more easier to manipulate table data, CottonFGD uses Bootstrap Table tools to extend the HTML table features. If you see one or more of the following features around a table (Fig 1.), then it is rendered by Bootstrap Table Plugin.
- A tool box on the top right corner
- A record box on the buttom left corner
- A pagination box on the buttom left corner
- (Sometimes)The 1st column is clickable

Server-side VS. Client-side
Sometimes searching in database might give a large amount of results, making the result table very large. Pagination is a good way to keep the whole web page tiny and clean. CottonFGD uses two types of pagination: server-side and client-side.
- Server-side pagination: When users submit their query searches, server returns only part of the whole result datasets based on the current setting of pagination (e.g. 10 results per page). The other results would only be returned when users turn to other pages from the pagination bar. In CottonFGD server-side pagination is only used in Search page, as it would often return thousands of results.
- Client-side pagination: When users submit their query searches, server returns the whole result datasets to the client browser, then the client browser finish the data pagination. In CottonFGD client-side pagination in most pages except for the Search page.
To end-users, the most important difference is for data export: In server-side pagination table, as the server only returns part of the result datasets, you should first change the pagination setup (see Fig 1.) to "All" to receive all results (This might be slow if your have thousands of results, so be careful). In client-side pagination, as all results have already been stored on your browser, you can directly export them without displaying all rows on the web page.
Search
After getting the result data table, users can input any keywords into the "Search" box (see Fig 1.) to search for rows which match the whole input keywords in any columns (No matter whether this column hidden or not). It has the following properties:
- Seaches are immediate, no other submit actions needed
- Seaches are case insensitive.
- Surrounding blanks would be automatically removed by your browser.
- After finishing searching, the data export function would only export your searched results.
- Empty the search box would give you back all the results
Column Hide/Show
If you get a table with many columns and only want to focus on some certain ones, you can use the column contrl button (see Fig 1.) to hide/show columns. At least one column should be kept. After your adjust columns, the data export function would export your selected columns.
In order to make the default table view clean, some tables whould hide unimportant columns by default (e.g. the P-value columns in searhing differentially expressed genes). You can view these hidden columns from the column control menu.
Data Selection
Sometimes the first column is checkable (Fig 1.). You can check/uncheck rows you want and click the top-left buttons to transfer your selected data to other pages. Clicking on the first checkbox (in the header row) will check/uncheck all the rows on the current page.
Pagination & Selection
If you want to select all the rows in a table with pagination, you should show all the data first and then select them.
Data Export
Besides manually copy-paste, users can use the data-export menu (see Fig 1.) to export the whole returned datasets (or filtered datasets) to separate files, and then download the files to your local devices.
Currently CottonFGD supports three types of exported files:
- TXT: Tab-delimited table files, can be opened by simple text editors.
- CSV: Comma-delimited table files, can be opened by simple text editors or directly by MS-Excel software (or other similar office suits).
- MS-Excel: MS-Excel files, can only be opened by MS-Excel software (or other similar office suits).
All the exported files have a same name "tableExport". Your have to rename them files manually. In addition, if you want to export the whole datasets in server-side pagination tables, please change the pagination setup (see Fig 1.) to "All" to receive all results.
Chart
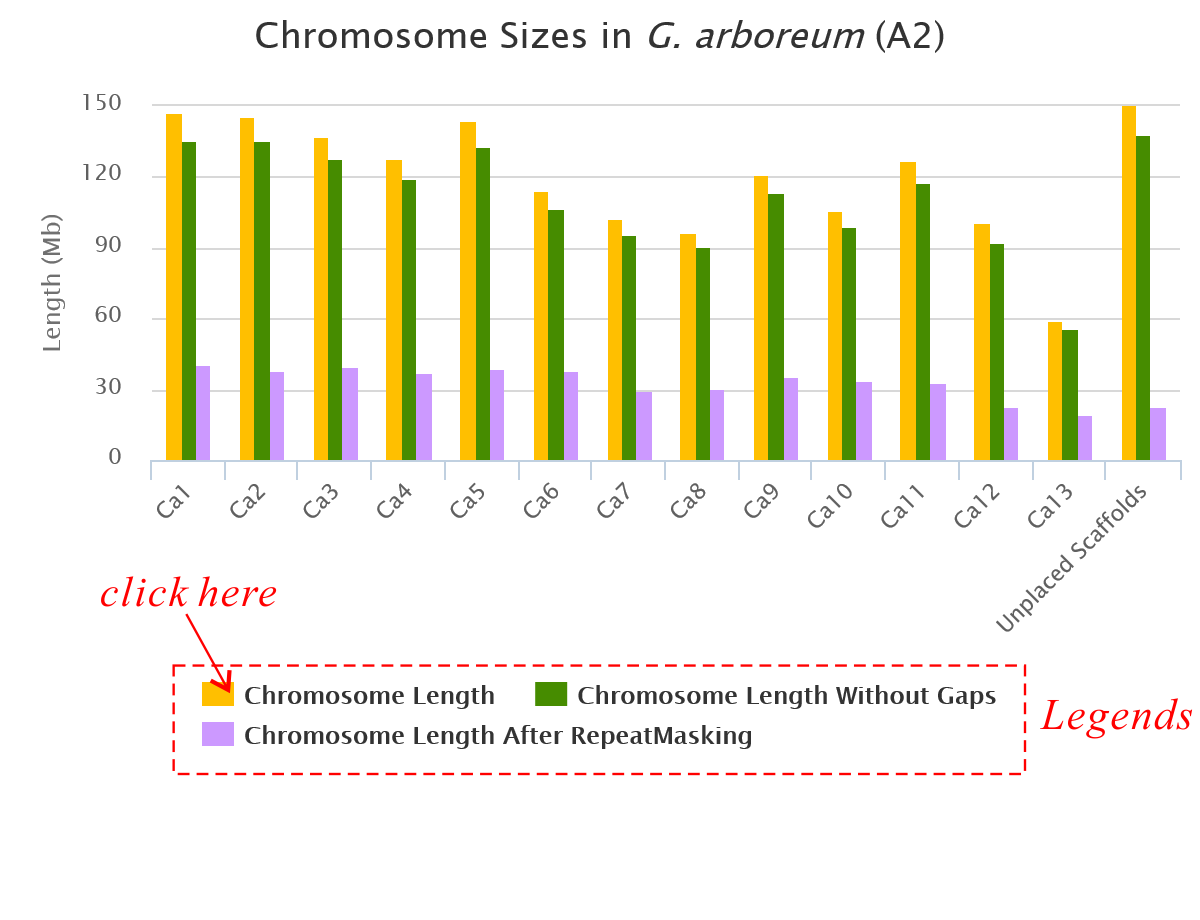
CottonFGD uses Highcharts to generate interactive statistical charts (line charts, column charts, pie charts, heatmap charts,..., etc, Fig 2.). Users can hover (mouse hover or device touch) on certain chart elements to view relevant values.

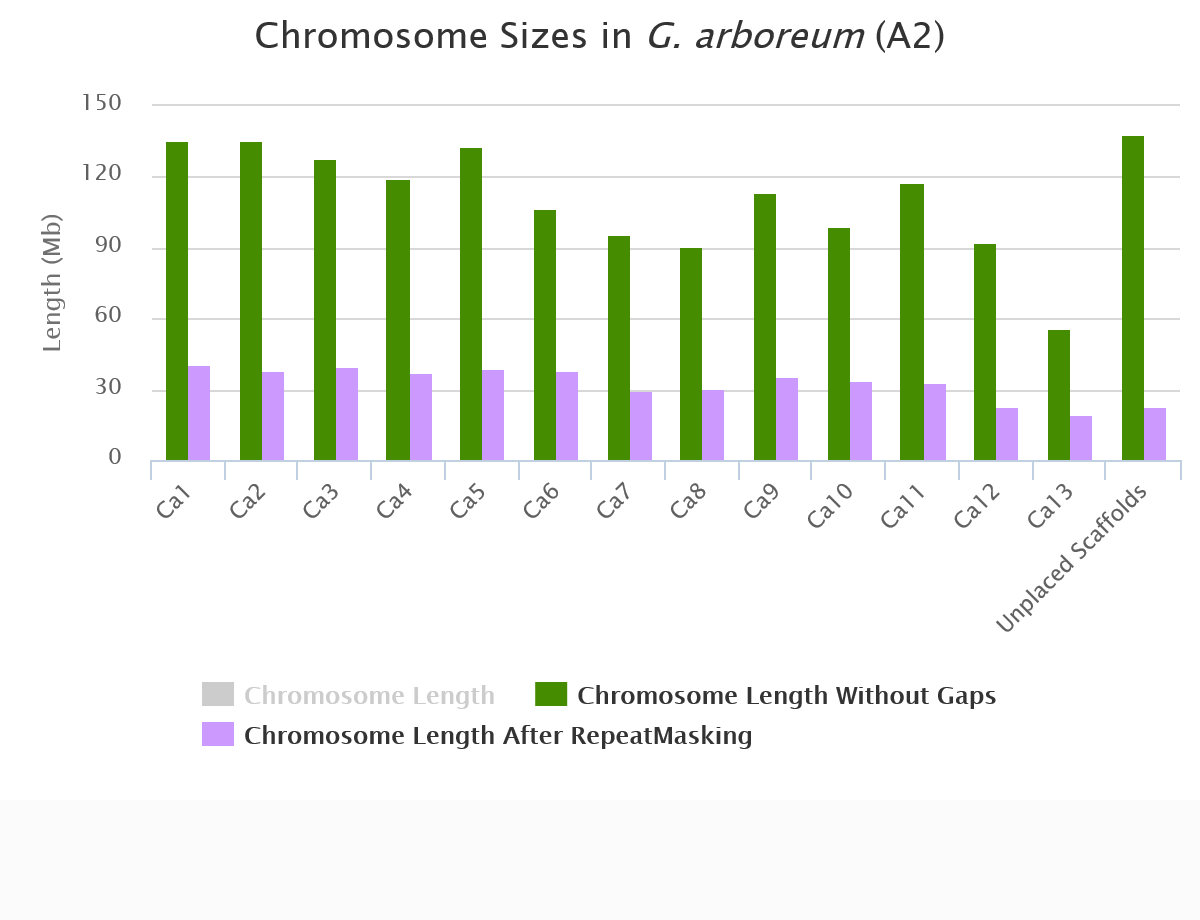
Series Hide/Show
Usually different colors are used to represent different "data samples" (or data types). Each colored element is called a "series" and has a relevant legend icon on the buttom side of the chart. These legend icons are in fact buttons. Users can click them to hide/show relevant series (Fig 3.).
Drill Down
Some data series (e.g., Repeat Element Statistics) are able to be divided into several sub-series. Highcharts allow users to "click into" these series to navigate into deeper sub-series (Fig 4.). Such action is called "Drill Down". If you see a series with an underline marked data label, or your mouse pointer changed when hovering on it, then it is able to be drilled down.
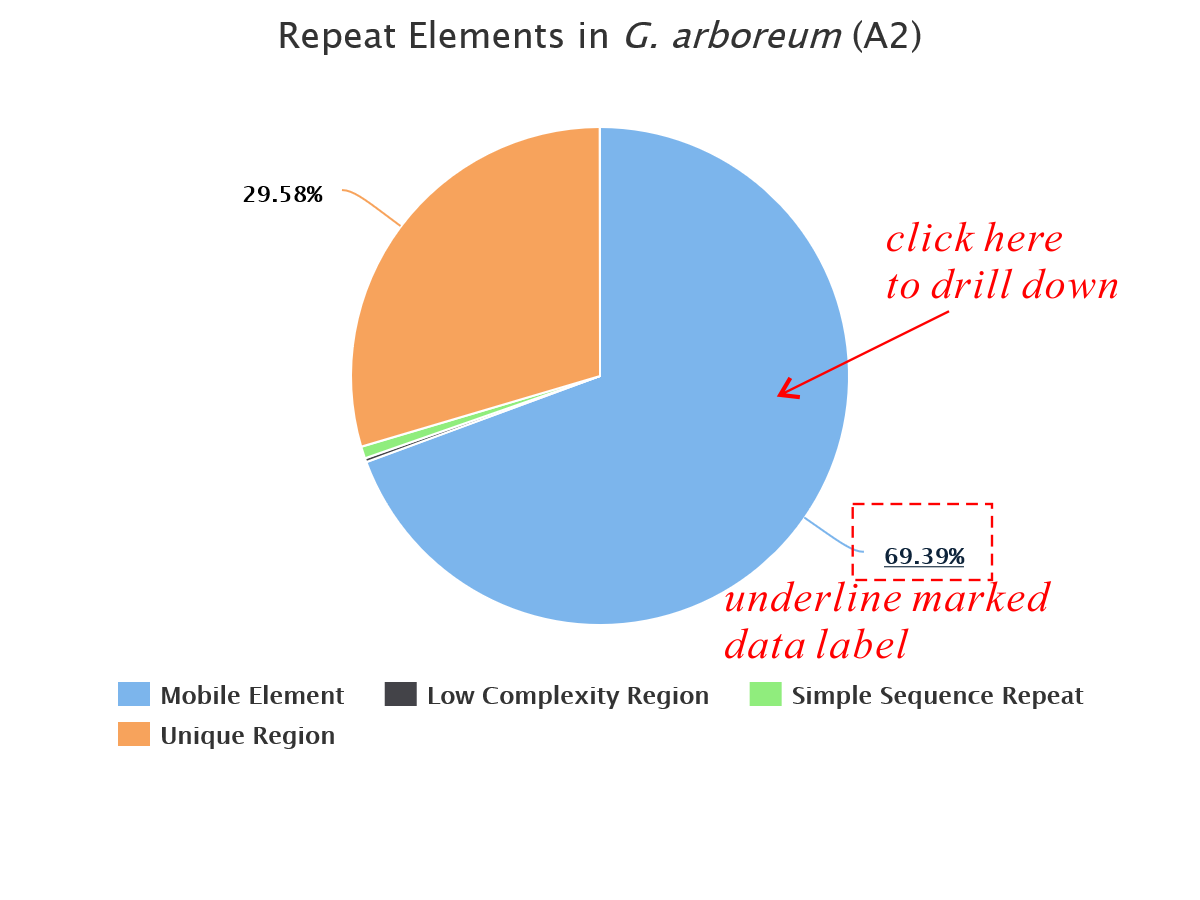
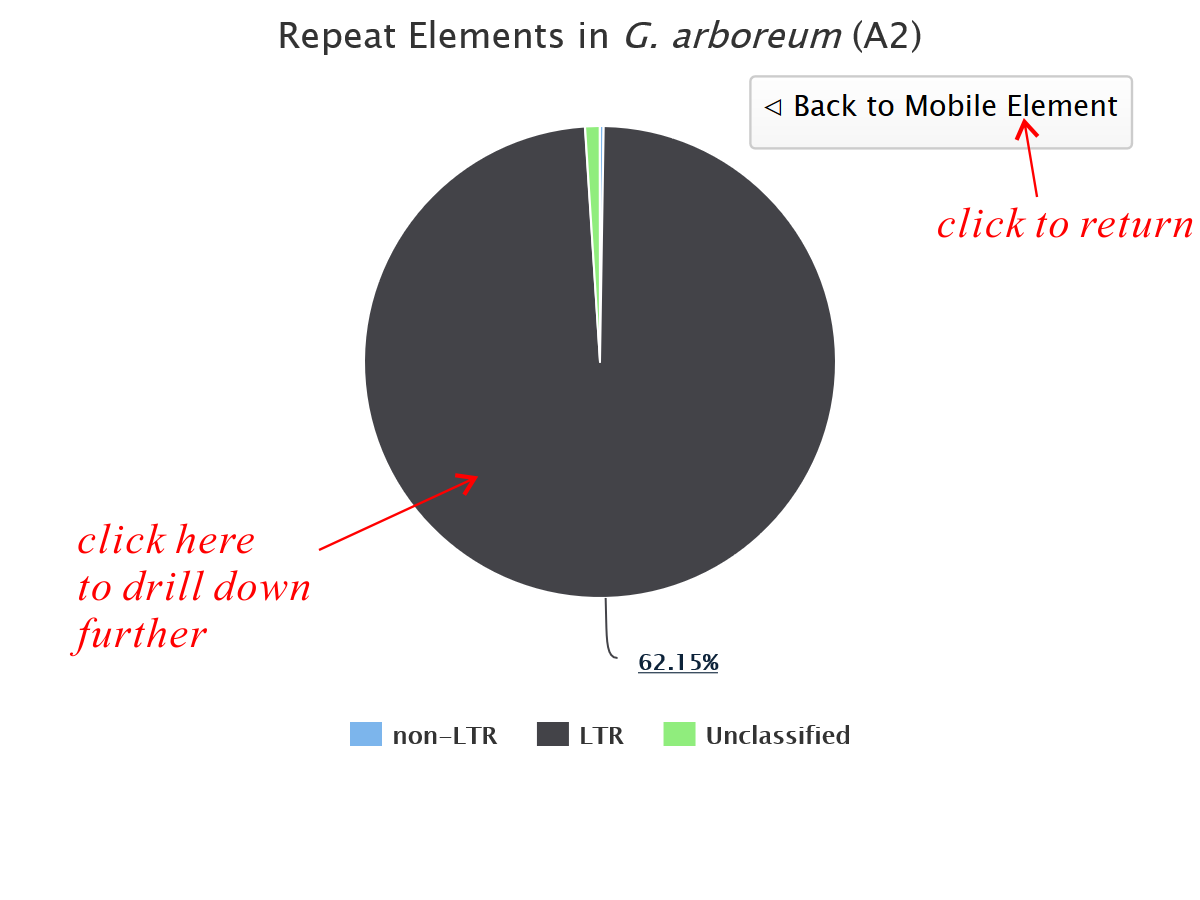
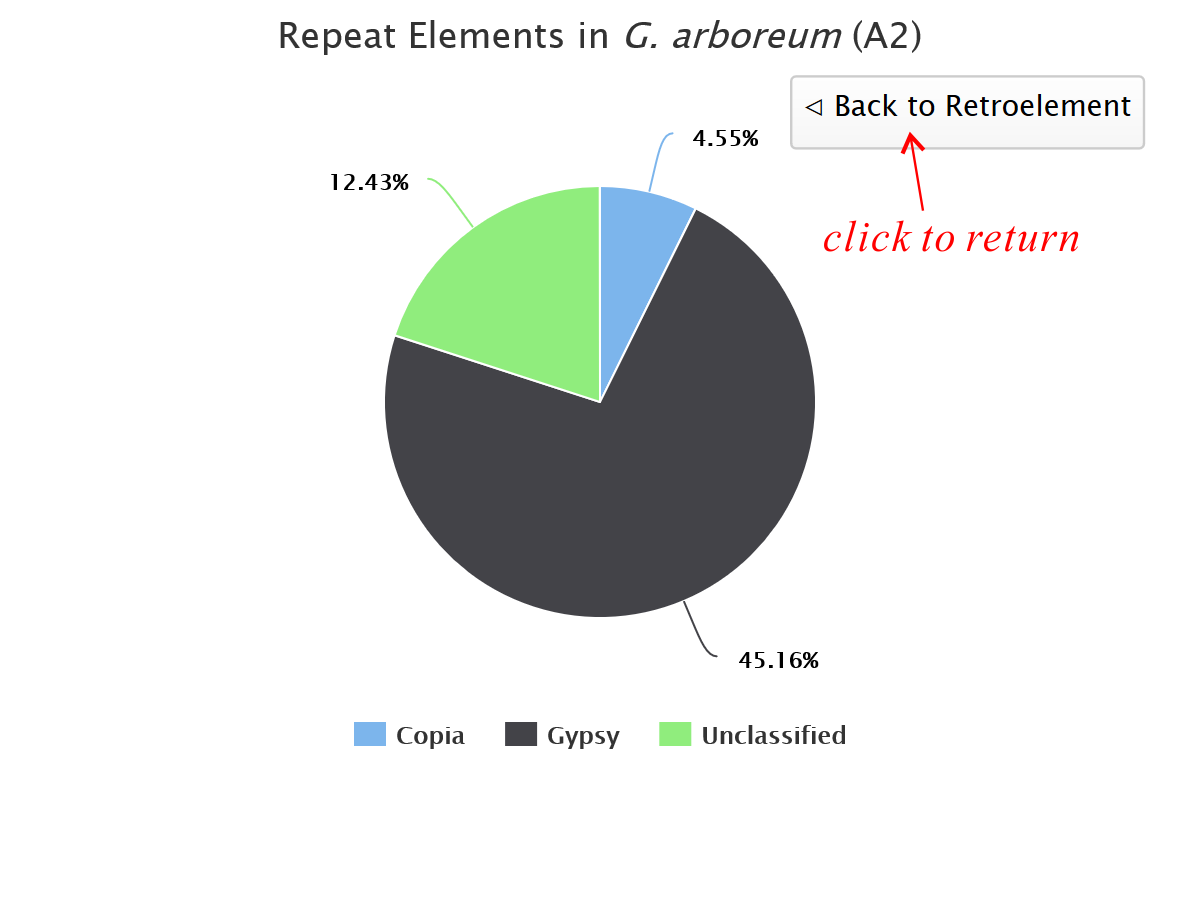
Chart Export
There exists a menu icon in the top right corner of each chart. Here users can export the chart in PNG or SVG format, or print it directly.
The Exported Chart Relects what You See on the Webpage
If you hide some data series, or drill down into deeper levels, the exported chart is also changed.
Form
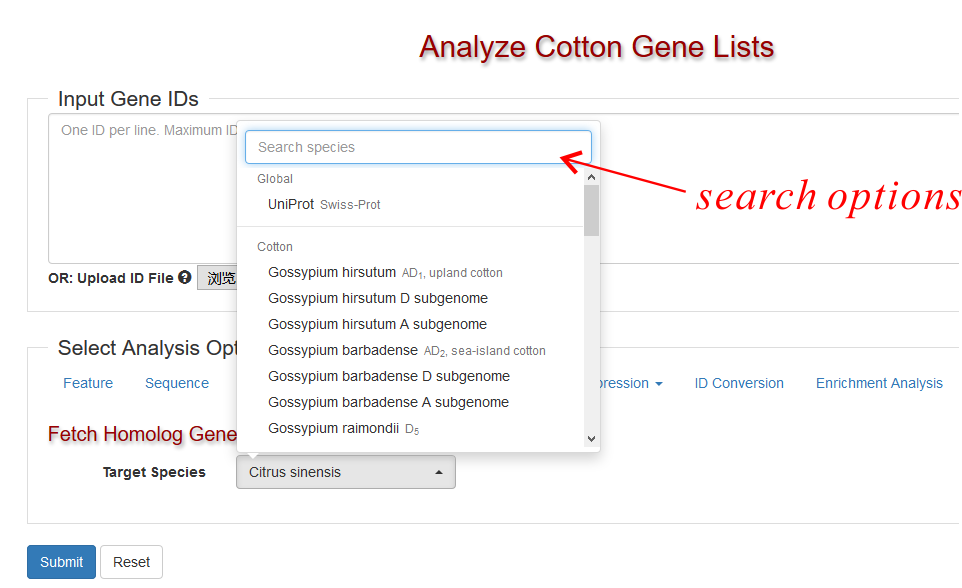
Selection
In order to convenient user's selection from a large amount of options, CottonFGD uses Bootstrap-select to add a search input box above the selection options (see Fig. 5). Users can search their target options without viewing the whole list one by one.
Input Suggestion
CottonFGD uses Bootstrap Ajax Typeahead Plugin plugin to enable input suggestion in text input fields. This feature is enabled in Search Page. When users type into more than 3 letters in the text input field, a drop down list would appear to help select possible options (i.e. names or descriptions, see Fig. 6).
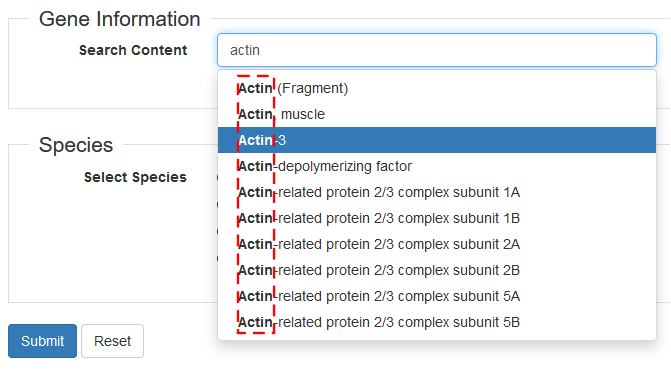
Suggested Options might not necessarily Exist in Cotton
The suggested options are selected from the name sets from relevant databases. Not all of them have relevant genes in cotton.
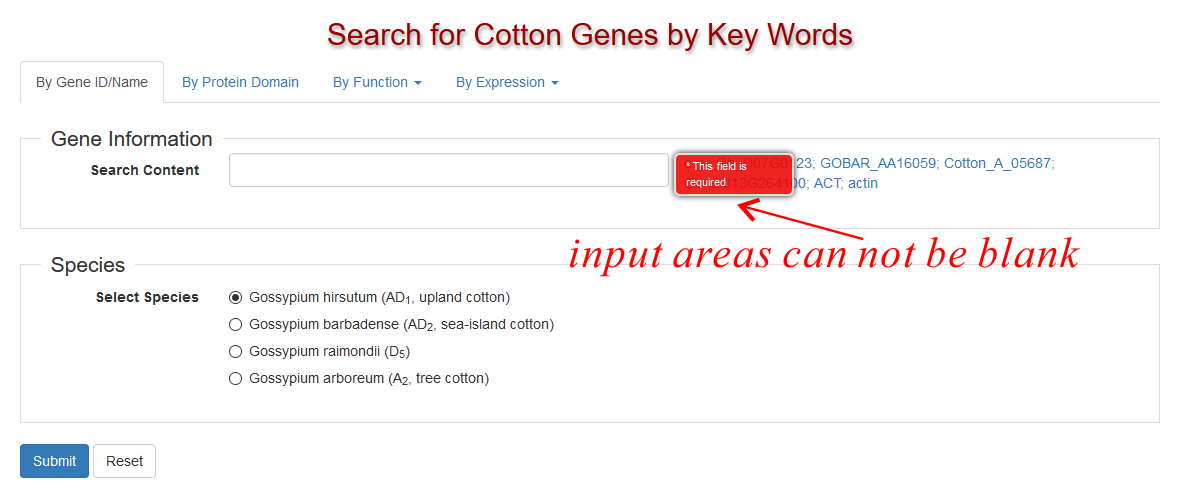
Form Validation
Except for some form fields with default values, all input areas are required to be completed before submit. If users leave out some fields or give incorrect values, the form is not able to be submitted and a red message box appears nearby to notify what should be input (see Fig. 7).
Flanking Blanks will Automatically be Trimmed
Blank strings flanking users' input will automatically be trimmed away. Therefore, foo and foo are the same.