Basic Information
This section is similar as that in gene profiles page. Here transcript sequence, CDS sequence and protein sequence could be viewed (≤ 10kb) and download.
DNA/Protein Statistics
This section shows some statistics based on this DNA/Protein sequences.
CDS Statistics
This section displays the base composition (A, T, G, C and
sometimes the ambiguous N) of the CDS sequence.
Protein Statistics
This section displays several protein property statistics based on the protein sequence.
Exon-Intron Structure
This section displays the Exon-Intron structure in a table similar as the Ensembl database.
Exon-Intron Structure Table
This table consists of 10 columns:
- ID: We order all the segments of CDS, intron, UTR and surround sequences in the feature strand order. Clicking on the ID hyperlink would turn to the relevant region in JBrowse.
- Type: Possible values are: CDS, intron, UTR5 and UTR3.
- Chromosome, Start, End and Strand
- Phase: The 3' end phase for CDS segments.
- Length: The length (bp) of this segment.
- Sequence: Upper case for UTR/CDS and Lower case for intron or upstream/downstream region. In the table, upstream/downstream sequences are shown ≤ 50 bases, and intron sequences are shown ≤ 25 bases in both 5' and 3' end. Users can click the Download button to download full length sequences.
Download Sequence
Clicking the Download button would generate a text file containing the separated and combined sequences for all the segments. The region length of upstream/downstream could be customized.
Protein Domain
This section displays associated protein domains. Different domains are grouped by their databases and can be viewed by clicking the leading list.
Domain View
The domain region is visualized by the FeatureViewer plugin. Clicking the top-right help icon to get usage.
Homology
This section displays best homologs in other plant species.
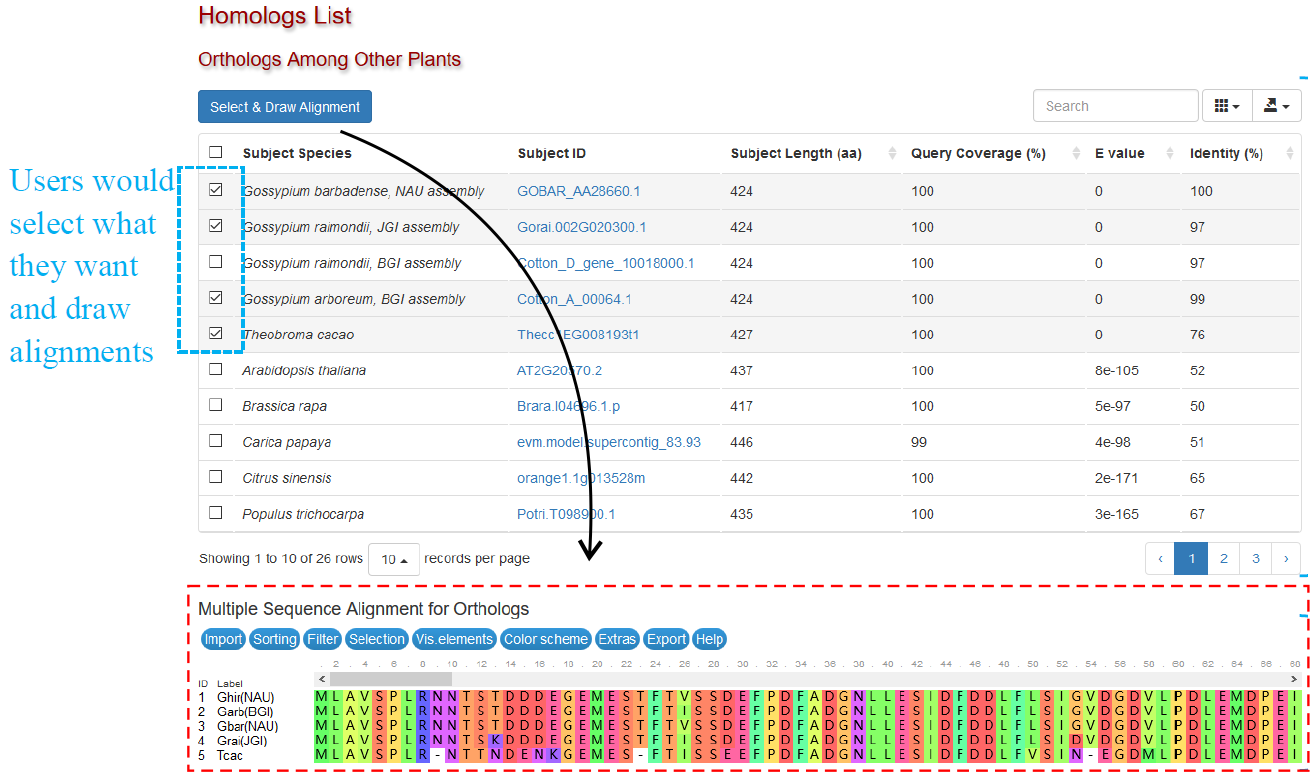
Orthologs Among Other Plants
This section displays best orthologs in other cotton species and 22 other representative plant species. Data of most plant species are from Phytozome, and the detailed information of each hit gene could be accessed by attached hyperlinks.
Users can select some (or all) genes in this table and draw a Multiple Sequence Alignment Figure (Fig. 1). It is rendered by the MSA plugin. Users can sort, edit and download the alignment using relevant menus.
Cross Database References
This section gives a link to the Plant Homology Database if this transcript has ortholog in Arabidopsis thaliana.
Function
This section displays associated Gene Ontology, IntroPro and Pathway information . It would display functional annotation data from multiple sources (Fig. 2).
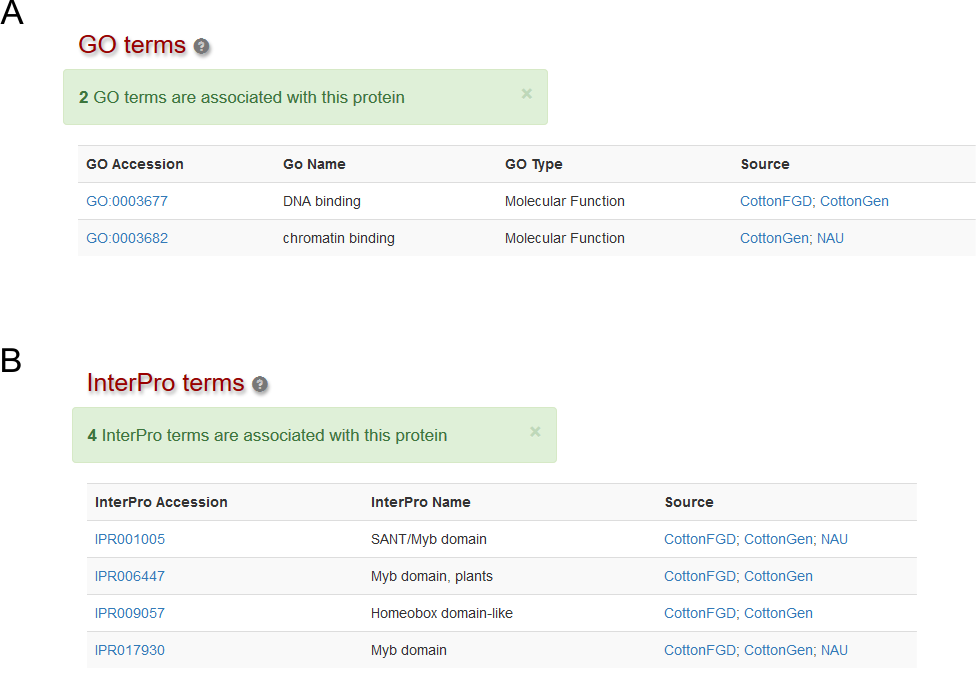
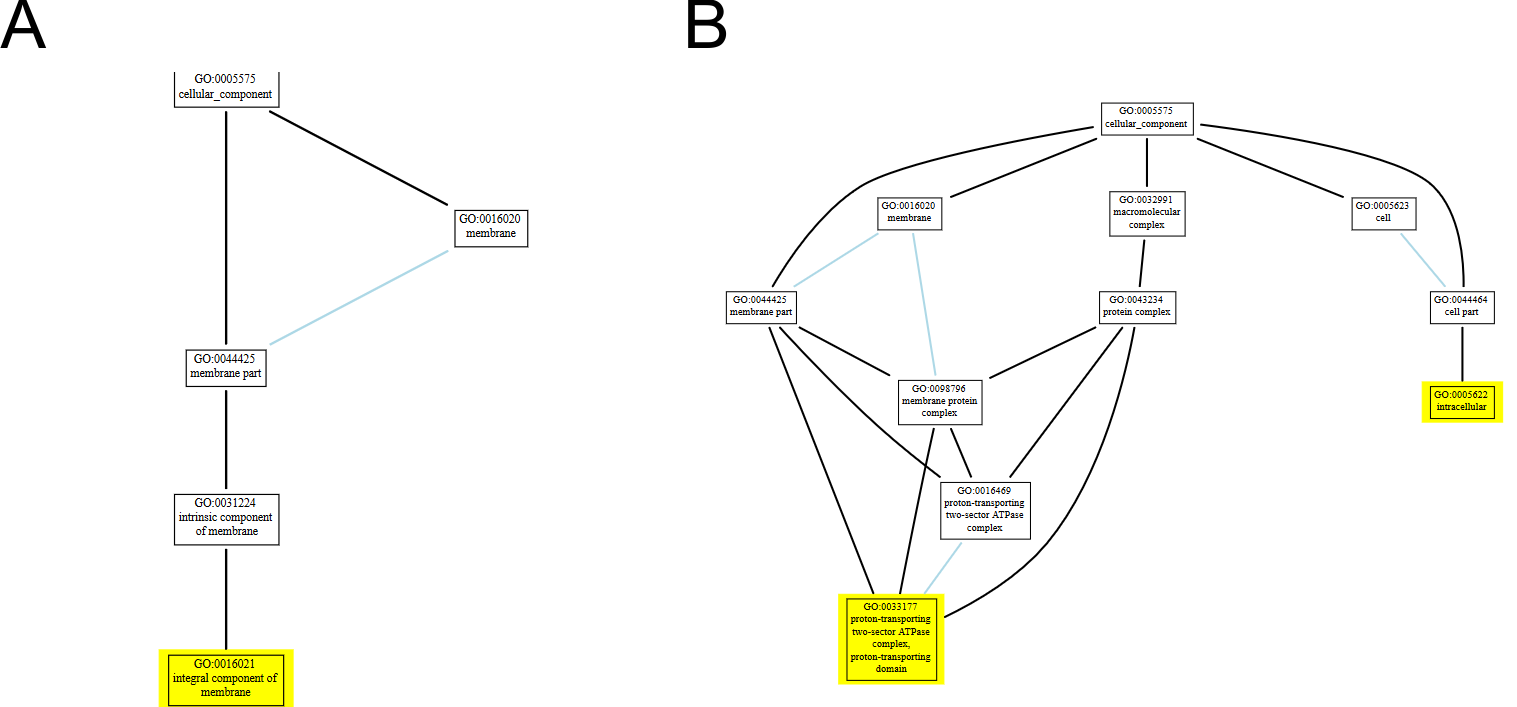
Gene Ontology Terms
CottonFGD uses the AmiGO service to visualize the relationship between the annotated GO item and its parents/children. GO items related to this transcript are highlighted. See Fig. 3A for a single GO item and Fig. 3B for multiple GO items.
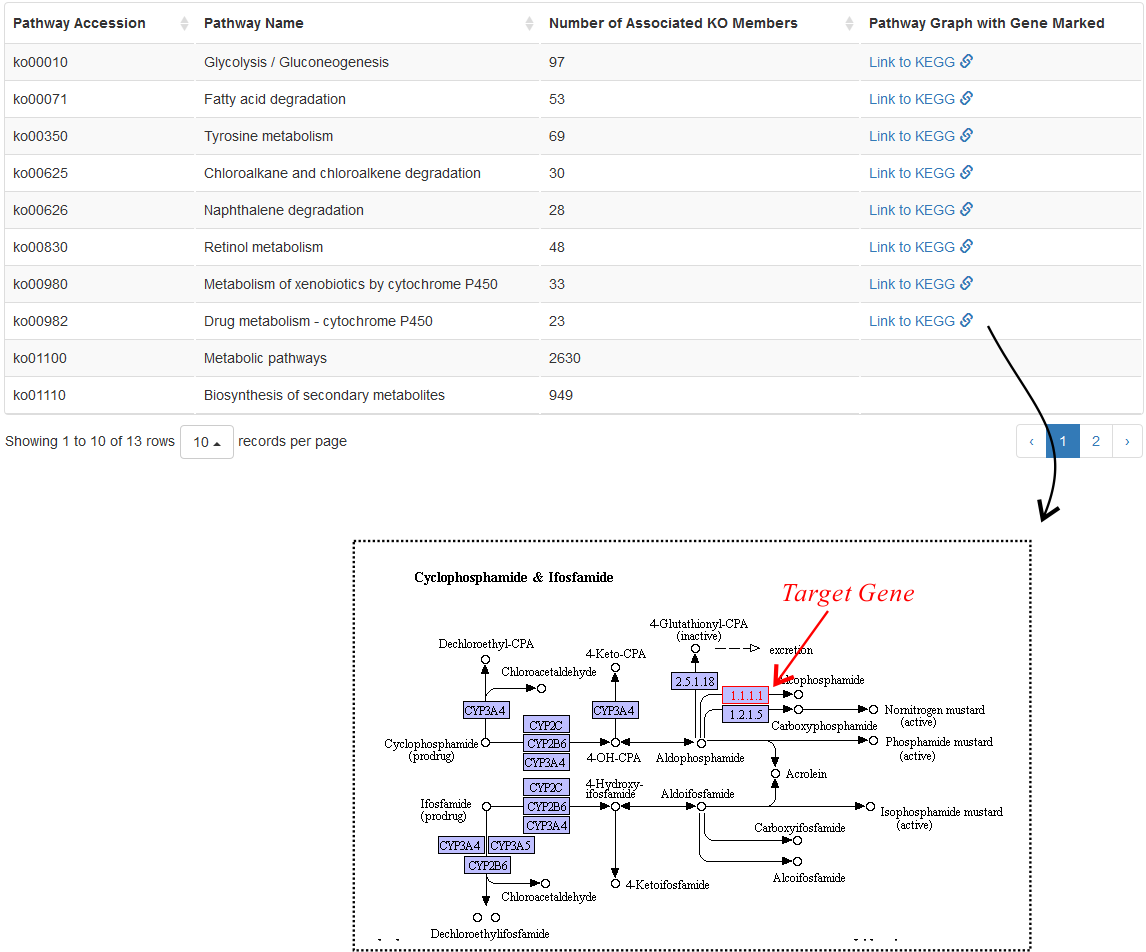
Pathway Terms
CottonFGD uses the KEGG website to visualize the relationship between this transcript and its associated pathway. In the pathway figure, the target transcript is marked in red (Fig. 4).
Large pathways (with ≥ 200 items) are not visualized as they are mainly macro pathways (for example, ko01100) and are not related to specific biological process.
Expression
The expression data of this transcript is grouped by experiment sets similar as the domain page.